Bite Back’s Commitment to Diversity, Equity, Inclusion & Belonging (DEIB)
Bite Back’s Commitment to Diversity, Equity, Inclusion & Belonging (DEIB)
Bite Back’s DEIB vision statement is part of our commitment to making meaningful progress towards a movement where everyone feels valued, respected, and empowered.
This vision has been co-developed by Bite Back’s young people, staff and trustees:
A fair food systems means our working culture and values, Real, Respectful, Resilient, Fresh and Energetic, reflects this vision. We support our staff, ambassadors and trustees to live Bite Back’s values in their work.
At Bite Back, DEIB means that our people are able to join and navigate the workplace, trusting they’ll be supported to thrive, and that we’ll respond with compassion and make change when things fall short. We recognise the systems of oppression which keep marginalised groups from power, and seek to proactively build equity. We are intentional about representation. We actively recruit under-represented voices, ensuring our staff team and youth board are representative of a wide variety of lived experiences.
We push to improve outcomes for those kept furthest from power, celebrate differences and ensure accessibility is built in, not added on.
Our aspiration and intention is that Bite Back is an organisation that recognises, shares and acts on its power and responsibility to young people, employees, community and wider society, driving equity and inclusion in every space, and in every decision.
Our equal opportunities data
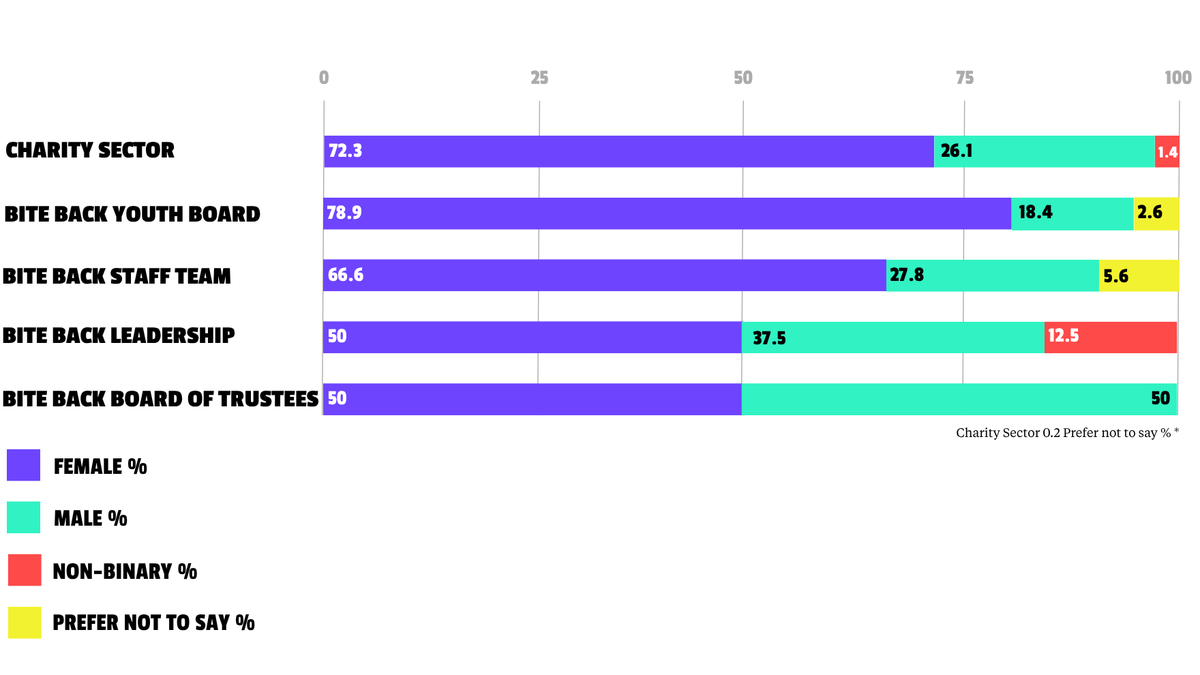
Working towards a more just food system means that our teams - from our Youth Board, to our Staff, to our Leadership, to our Trustees - should reflect diverse perspectives and life experiences. We believe diverse and rich representation strengthens our collective impact to improve child health.
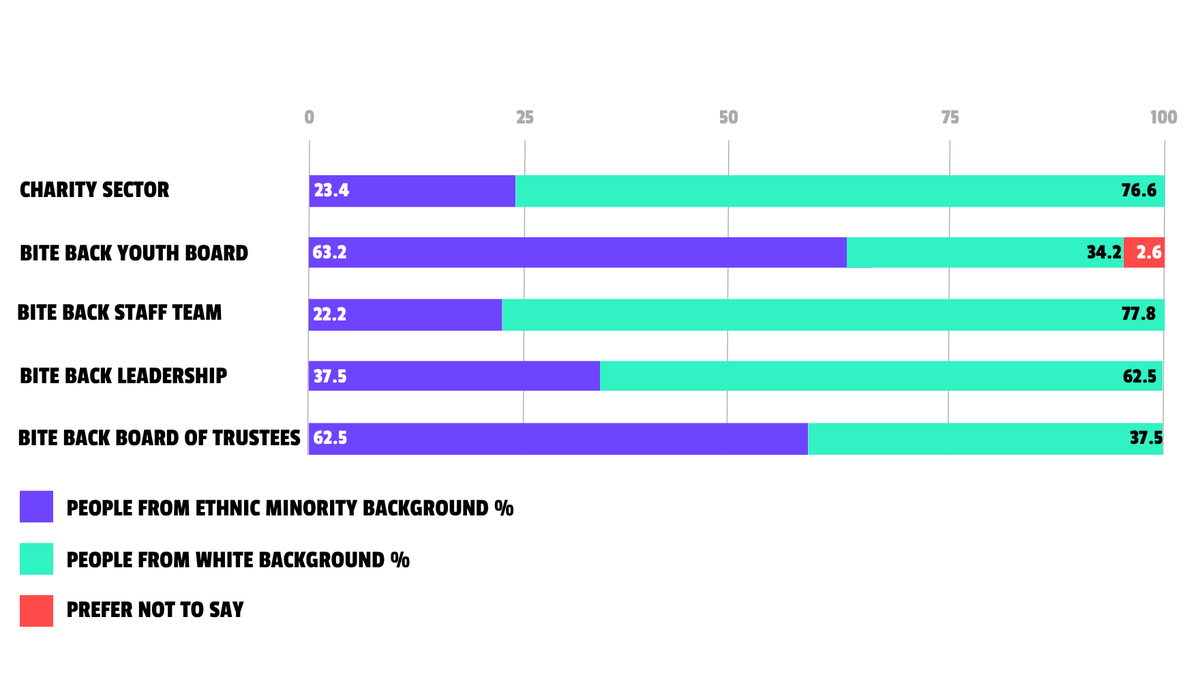
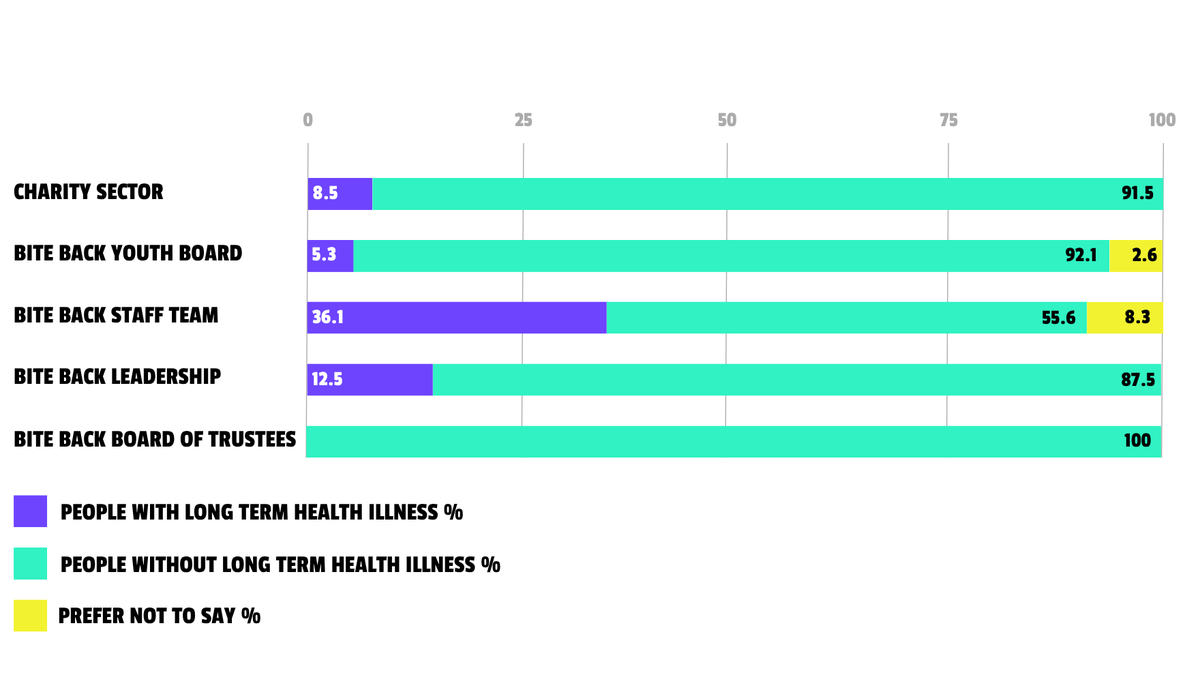
We recognise that within our sector, organisations and their leadership are not always representative of the communities they serve. We want to be transparent about this, and to measure our progress over time through our equal opportunities data. As part of our accountability to DEIB at Bite Back, our HR team collects consistent and transparent data across ethnicity, gender, Free School Meals (FSM), and long-term disability, spanning our Youth Board, Staff, Leadership, and Trustees.
We have intentionally included recipients of FSM as a measure of socio-economic background - a factor that is deeply relevant to our mission, our community, and the lived experiences we represent externally.

We have benchmarked our own data against the wider charity sector, using Charity People and Oxford’s HR’s January 2026 findings as the most recent and sector specific dataset we identified
These graphs reflect data collected in July 2026.
Gender
Ethnicity
LONG TERM HEALTH
Received FREE SCHOOL MEALS
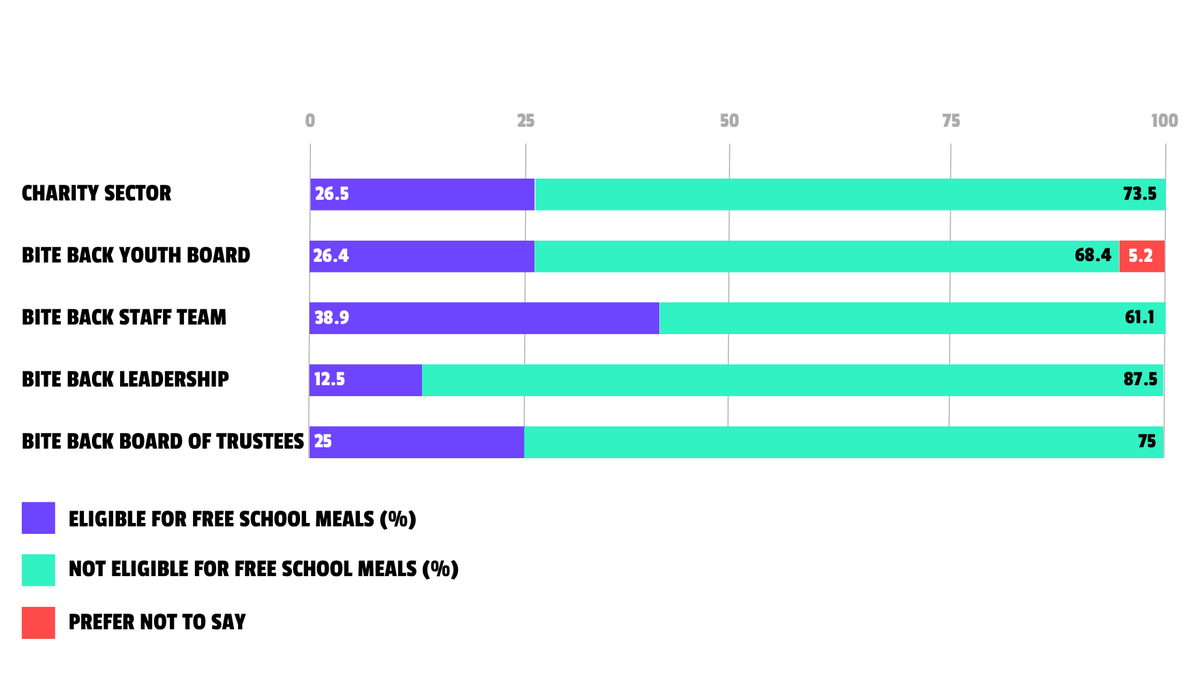
Free School Meals benchmark
The Free School Meals (FSM) benchmark is based on the latest available Department for Education (England) data for the 2025–26 academic year. This replaces the benchmark used in previous reporting, as an equivalent FSM dataset is not available within the charity sector benchmarking survey. While this benchmark does not include Scotland, it provides the most appropriate comparison currently available.
Diversity within our Programmes: Bite Back in Schools
As well as reporting on our organisation's diversity, we also want to reflect the diversity of the young people we work with through our programmes. The figures below from our Bite Back in Schools programme provide additional context on the communities we reach. They are presented separately and are not intended as a direct comparison with our Board, Leadership Team, Staff Team or Youth Board.
For schools participating during the 2025–26 academic year:
- 32.6% of students were eligible for Free School Meals, compared with an average of 26.5% of pupils in England.
- 8.3% of participating schools were Special Educational Needs (SEN) or Pupil Referral Unit (PRU) settings, compared with these settings normally representing approximately 5.7% of all schools in England.
Early indications suggest the 2026–27 programme cohort will be even more representative of the communities we work with.
What we’re doing next
We will continue to review and improve our DEIB work through regular data collection and reflection. Our next survey will take place in April 2027, and we are committed to keeping this page updated with our latest findings and actions.
By sharing this data openly, we aim to be transparent about our progress, honest about where we need to improve, and accountable to the young people, communities, and colleagues we serve.
Learn more about the movement
Since 2019 we've been biting back - and this is just the beginning. Take a look at some of the moments that have defined our journey so far.